


Stockwatch: The Top Three Pharma Stocks to Bet On

Pharma stocks have been outperforming the Sensex and the Nifty ever since the Coronavirus struck the world. Big Bull Rakesh Jhunjhunwala has now also endorsed this sector saying that this might just be the beginning of a bull run in pharmaceutical stocks.So, here are three Pharma stocks you can bet on and why, as Prem Doshi of Ace Equities analyses them exclusively for GoNews.
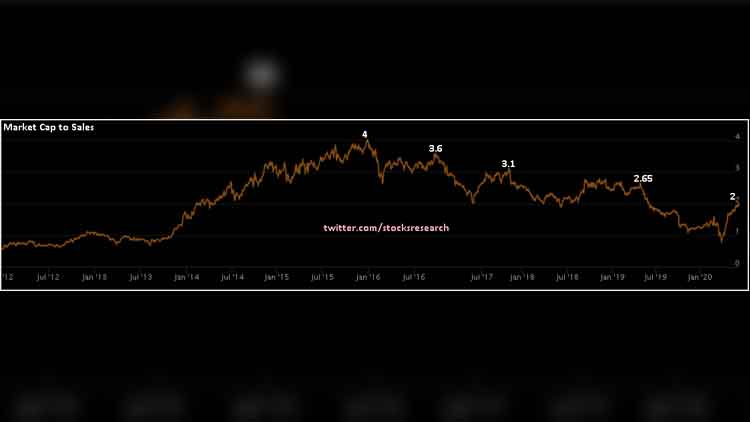
1 – Aurobindo Pharma Ltd Basics 82.6% from formulations and 17.4% from APIs USA has largest geography with 47.7% |Europe 31.2% |India only 11.8% |Remaining ROW. Good market share in Kidney related medicines, Overall, a well diversified portfolio. Debt has been stable in the last 3 years at around Rs 5,000 crores, comparable to the Industry average. This year – 18% revenue growth and 19% bottom line growth. Revenue Rs 23,098 crores, PAT Rs 2,831 crores, EPS 48.31, Dividend Yes, Last 10 years only 1 loss year in 2012. Current Price: 775, Market Cap Rs 45,400 crores, ROE 19%, ROCE 18.45%. Stock P/E: 16x, Market Cap to Sales 1.97x.
Upside potential on purely P/E high basis is 85% to 98%. However, if the peak comes early at last high of 22x that will leave only 37.5% gains on the table.
1 – Aurobindo Pharma Ltd Basics 82.6% from formulations and 17.4% from APIs USA has largest geography with 47.7% |Europe 31.2% |India only 11.8% |Remaining ROW. Good market share in Kidney related medicines, Overall, a well diversified portfolio. Debt has been stable in the last 3 years at around Rs 5,000 crores, comparable to the Industry average. This year – 18% revenue growth and 19% bottom line growth. Revenue Rs 23,098 crores, PAT Rs 2,831 crores, EPS 48.31, Dividend Yes, Last 10 years only 1 loss year in 2012. Current Price: 775, Market Cap Rs 45,400 crores, ROE 19%, ROCE 18.45%. Stock P/E: 16x, Market Cap to Sales 1.97x.
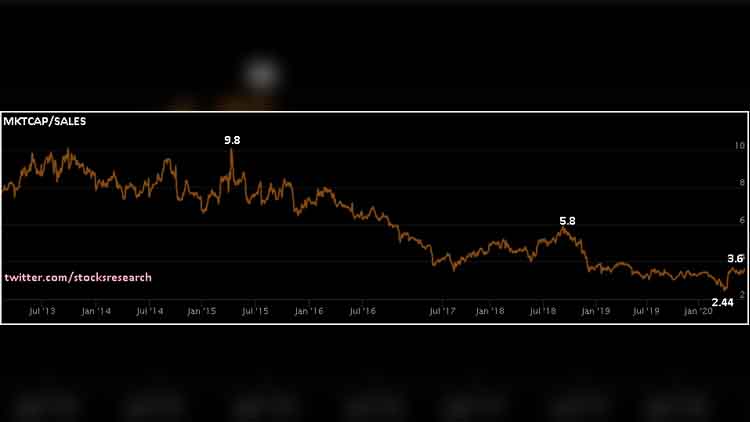
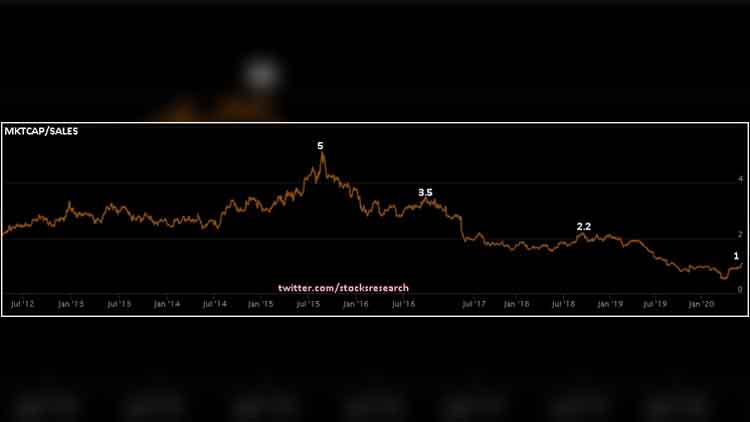
Historical Valuations Chart

Upside potential on purely P/E high basis is 85% to 98%. However, if the peak comes early at last high of 22x that will leave only 37.5% gains on the table.
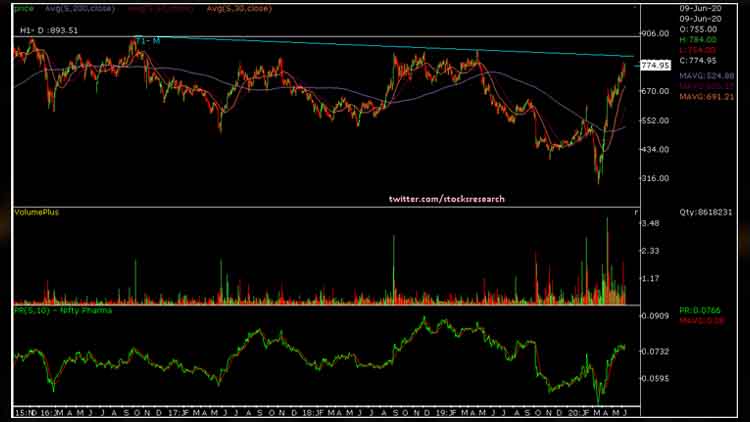
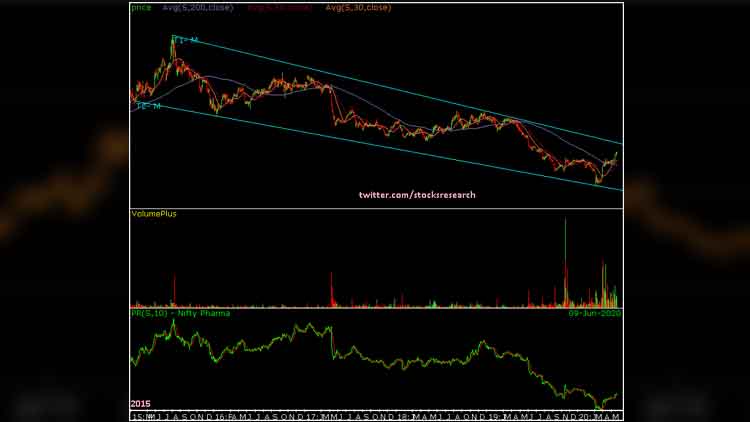
Technical View
Historical Valuations Chart
Technical View

Historical Valuations Chart
Technical View
Latest Videos
 Beat Ra")

 Def")


