


Watch: NASA, Partner Space Agencies Amass Global View of COVID-19 Impacts
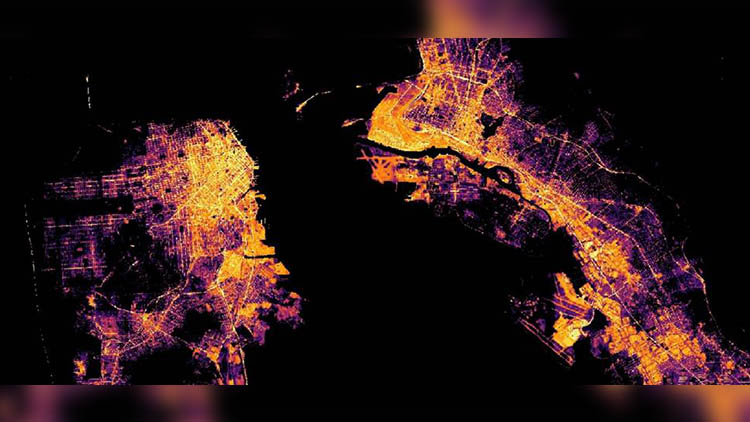
(Tracking global and local changes brought on by the world’s response to the COVID-19 pandemic. The above image shows San Francisco Bay at night. Credit: NASA)
In response to the global COVID-19 pandemic, NASA, ESA (European Space Agency), and JAXA (Japan Aerospace Exploration Agency) have joined forces to use the collective scientific power of their Earth-observing satellite data to document planet-wide changes in the environment and human society. The wealth of these agencies’ collective information now is available at the touch of a finger.
In an unprecedented collaboration, the three space agencies have created the joint COVID-19 Earth Observation Dashboard (https://eodashboard.org/), which integrates multiple satellite data records with analytical tools to allow user-friendly tracking of changes in air and water quality, climate change, economic activity, and agriculture. (COVID-19 led to changes in human activities around the globe. Some bodies of water have run clearer, emissions of pollutants have temporarily declined, and transportation and shipment of goods have decreased). This tri-agency data resource gives the public and policymakers a unique tool to probe the short-term and long-term impacts of pandemic-related restrictions implemented around the world. The dashboard will continue to grow with new observations added over the coming months as the global economy gradually reopens. “Together NASA, ESA, and JAXA represent a great human asset: advanced Earth-observing instruments in space that are used every day to benefit society and advance knowledge about our home planet,” said Thomas Zurbuchen, NASA associate administrator for science. “When we began to see from space how changing patterns of human activity caused by the pandemic were having a visible impact on the planet, we knew that if we combined resources, we could bring a powerful new analytical tool to bear on this fast-moving crisis.” Air quality changes around the world were among the first noticeable impacts of pandemic-related stay-at-home orders and reductions in industrial activity that emerged from satellite observations. One air pollutant, nitrogen dioxide (NO2), which is primarily the result of burning fossil fuels for transportation and electricity generation, shows up clearly in satellite data. In additional to the global view of NO2, targeted regional areas include Los Angeles, Tokyo, Beijing, Paris, and Madrid. Changes in another critical component of our atmosphere, carbon dioxide (CO2), are highlighted in the dashboard to probe how global and local reactions to the pandemic have changed concentrations of this climate-warming greenhouse gas. A recent study in the journal Nature estimated that a three-month economic slowdown such as the world has just experienced would temporarily reduce the expected increase in CO2 concentrations from emissions into the atmosphere by a fraction of a percent. The dashboard presents data from a NASA satellite to look for global-scale, long-term changes in CO2. Carbon dioxide observations from a JAXA satellite zooms in on changes in select urban areas such as New York, San Francisco, Tokyo, and Delhi. Analysis from both NASA and JAXA data sets are consistent with the estimates of emission reductions in the Nature study. Recent water quality changes have been reported in a few locations that typically have intense human activities, such as industry and tourism, which have decreased during the pandemic. The dashboard presents targeted satellite observations from all three agencies of total suspended matter and chlorophyll concentrations in select coastal areas, harbors, and semi-enclosed bays to assess what has produced these changes in water quality, how widespread they may be, and how long they last. Long Island Sound, the North Adriatic Sea, and Tokyo Bay are among the areas examined. Widespread declines in global economic activity are a well-known impact of the pandemic. Observations from space over time of shipping activity in ports, cars parked at shopping centres, and nighttime lights in urban areas can be used as indicators of how specific sectors of the economy have been affected. Satellite data from each agency and commercial data purchased by NASA and ESA are presented in the dashboard to quantify these changes in Los Angeles; the Port of Dunkirk, France; Ghent, Belgium; Beijing, and other locations. (In this video, leaders from each agency – Thomas Zurbuchen (NASA), Josef Aschbacher (ESA), and Koji Terada (JAXA) – discuss their unprecedented collaboration. Credits: NASA/ESA/JAXA)
Also Read:
In an unprecedented collaboration, the three space agencies have created the joint COVID-19 Earth Observation Dashboard (https://eodashboard.org/), which integrates multiple satellite data records with analytical tools to allow user-friendly tracking of changes in air and water quality, climate change, economic activity, and agriculture. (COVID-19 led to changes in human activities around the globe. Some bodies of water have run clearer, emissions of pollutants have temporarily declined, and transportation and shipment of goods have decreased). This tri-agency data resource gives the public and policymakers a unique tool to probe the short-term and long-term impacts of pandemic-related restrictions implemented around the world. The dashboard will continue to grow with new observations added over the coming months as the global economy gradually reopens. “Together NASA, ESA, and JAXA represent a great human asset: advanced Earth-observing instruments in space that are used every day to benefit society and advance knowledge about our home planet,” said Thomas Zurbuchen, NASA associate administrator for science. “When we began to see from space how changing patterns of human activity caused by the pandemic were having a visible impact on the planet, we knew that if we combined resources, we could bring a powerful new analytical tool to bear on this fast-moving crisis.” Air quality changes around the world were among the first noticeable impacts of pandemic-related stay-at-home orders and reductions in industrial activity that emerged from satellite observations. One air pollutant, nitrogen dioxide (NO2), which is primarily the result of burning fossil fuels for transportation and electricity generation, shows up clearly in satellite data. In additional to the global view of NO2, targeted regional areas include Los Angeles, Tokyo, Beijing, Paris, and Madrid. Changes in another critical component of our atmosphere, carbon dioxide (CO2), are highlighted in the dashboard to probe how global and local reactions to the pandemic have changed concentrations of this climate-warming greenhouse gas. A recent study in the journal Nature estimated that a three-month economic slowdown such as the world has just experienced would temporarily reduce the expected increase in CO2 concentrations from emissions into the atmosphere by a fraction of a percent. The dashboard presents data from a NASA satellite to look for global-scale, long-term changes in CO2. Carbon dioxide observations from a JAXA satellite zooms in on changes in select urban areas such as New York, San Francisco, Tokyo, and Delhi. Analysis from both NASA and JAXA data sets are consistent with the estimates of emission reductions in the Nature study. Recent water quality changes have been reported in a few locations that typically have intense human activities, such as industry and tourism, which have decreased during the pandemic. The dashboard presents targeted satellite observations from all three agencies of total suspended matter and chlorophyll concentrations in select coastal areas, harbors, and semi-enclosed bays to assess what has produced these changes in water quality, how widespread they may be, and how long they last. Long Island Sound, the North Adriatic Sea, and Tokyo Bay are among the areas examined. Widespread declines in global economic activity are a well-known impact of the pandemic. Observations from space over time of shipping activity in ports, cars parked at shopping centres, and nighttime lights in urban areas can be used as indicators of how specific sectors of the economy have been affected. Satellite data from each agency and commercial data purchased by NASA and ESA are presented in the dashboard to quantify these changes in Los Angeles; the Port of Dunkirk, France; Ghent, Belgium; Beijing, and other locations. (In this video, leaders from each agency – Thomas Zurbuchen (NASA), Josef Aschbacher (ESA), and Koji Terada (JAXA) – discuss their unprecedented collaboration. Credits: NASA/ESA/JAXA)
Latest Videos
 Beat Ra")

 Def")


