‘Poverty’ Of Poverty Data in India

The Central Government has announced that it will provide foodgrains as ration to 80 crore Indians to alleviate them from hardships of Corona Pandemic, especially after the second wave in April and May of 2021. This is the same number of poor identified by the UPA government in the Food Security Act in 2013. This raises the question whether in the seven years of NDA government from 2014 to 2021 was there no reduction in poverty in India. How did the Modi government reach this 80 crore number when it has not published any poverty related data since its inception in 2014.
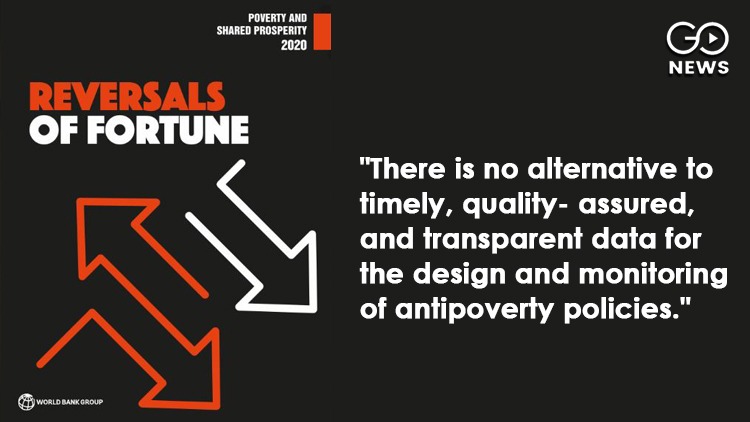
The government had refused to publish the Household Survey Data in 2017-18 questioning its authenticity. So the last authentic data on Indian households are from year 201-12. The World Bank in its latest report ‘Poverty and Shared Prosperity- Reversal of Fortunes’ – has raised concerns about India’s poverty data unavailability specifically. It has warned that - "There is no alternative to timely, quality- assured, and transparent data for the design and monitoring of antipoverty policies."
Here are the excerpts from the report in their entirety: Measuring Poverty in India without Recent Data : World Bank Group Citing concerns over the quality of the data, the government of India decided not to release the 2017/18 All-India Household Consumer Expenditure Survey data from the 75th round, conducted by the National Statistical Office. This decision leaves an important gap in understanding poverty in the country, South Asia, and the world in recent years. The latest comprehensive household consumption expenditure survey data available for estimating poverty for India date to 2011/12, the 68th round of the National Sample Survey. The 2018 Poverty and Shared Prosperity report used the 2014/15 72nd round of the National Sample Survey, which includes some information on household characteristics and expenditures (but not the full consumption module used for poverty measurement) to impute a more comprehensive value of consumption (Newhouse and Vyas 2018; World Bank 2018). The results of this survey-to-survey imputation were used to derive the India estimate that underpins the 2015 global poverty count (see Chen et al. 2018, for details). Given the relevance of India for global poverty measurement and the lack of more recent data, this box summarizes several methodologies that have been used to approximate a poverty estimate for India to be used in the 2017 global poverty count. All these estimates are subject to strong assumptions; therefore, considerable uncertainty remains over poverty in India in 2017, and this uncertainty can be resolved only if new survey data become available. The first method is a pass- through exercise similar to the method adopted by the World Bank in its nowcasts and forecasts of global poverty (see below). A pass-through is a discount factor that accounts for the differences in growth rates in per capita household consumption expenditures in national accounts and the mean per capita household consumption expenditures recorded in surveys. Using all comparable consumption surveys available in PovcalNet, a pass-through rate of 0.67 (with a 95 percent confidence interval of [0.59, 0.75]) is estimated that is to be applied to per capita household final consumption expenditure (HFCE) growth in national accounts.a This estimate is in line with many of the pass-through rates available in the literature on this issue (Sen 2000; Datt, Kozel, and Ravallion 2003; Deaton and Kozel 2005; Lakner et al. 2020). Applying this pass-through estimate to per capita HFCE growth in India as reported in the World Development Indicators using official sources results in a national poverty rate estimate of 10.4 percent in 2017 for the US$1.90 poverty line, which translates into 139 million people living in extreme poverty. This number underpins the global poverty estimate (9.2 percent) for 2017 and the nowcast and forecast exercises shown in the rest of this chapter. The second approach uses survey-to-survey imputation techniques, similar to the approach used in the 2018 Poverty and Shared Prosperity report, to impute consumption into the 2017/18 Social Consumption Survey for Health (National Sample Survey, 75th round). This approach results in a lower national poverty estimate of 9.9 percent in 2017, with a 95 percent confidence interval of between 8.1 and 11.3. The India and South Asia estimates are reported for the widest range of estimates derived from these methods. For India, the values range between 8.1 percent and 11.3 percent nationally, that is, between 109 million and 152 million people.c This value would translate to between 7.7 percent and 10.0 percent poor in South Asia, that is, between 137 million and 180 million people. Neither approach is without limitations. The pass-through approach assumes that the national accounts estimates of HFCE growth are accurate and that growth is distribution-neutral. Both these assumptions have been the subject of recent debate in India. The survey-to-survey method takes advantage of the variation in the survey data to capture changes in the distribution of welfare. However, if the imputation is done between periods too far apart, it may fail to capture important changes in the behavior of markets. Important structural changes in the Indian economy between 2011 and 2017 may not be captured by these imputation techniques. Thus, the range of poverty estimates could be even wider than those presented in this report. The limitations of the methods described add to concerns about the lack of access to survey data to measure standards of living in India. Several economists and policy experts have used public news and media outlets to cite figures from different sources of data leading to opposite views about the direction of poverty rates in India in recent years.e The lack of data creates doubts among the general public, obstructs scientific debate, and hinders the implementation of sound, empirically based development policies. There is no alternative to timely, quality- assured, and transparent data for the design and monitoring of antipoverty policies. Appendix: a. Further details can be found in Edochie et al. (forthcoming). Because pass-through rates are found to vary systematically between consumption and income surveys (Lakner et al. 2020), only consumption surveys are included in this sample (which is the welfare aggregate used in India). For all regions except Sub-Saharan Africa, HFCE is the national accounts aggregate used by PovcalNet to line up surveys to the reference year (Prydz et al. 2019). To isolate real changes in consumption from one survey to the next, it is important to focus on comparable surveys using the comparability metadata described in Atamanov et al. (2019). b. See World Development Indicators (database), World Bank, Washington, DC, http://data.worldbank.org/products/wdi. c. The 95 percent confidence interval for the pass-through estimates gives a range of 10.0 percent to 10.8 percent for the national poverty rate, which is nested within this range. d. Academics have argued that India’s growth in gross domestic product from official sources may be overstated (A. Subramanian 2019), but these findings are disputed (Goyal and Kumar 2019). Regarding changes in inequality, Chanda and Cook (2019) and Chodorow-Reich et al. (2020) find a negative short-term impact of the demonetization introduced in November 2016 among the poorest groups, which dissipates after several months. Lahiri (2020), meanwhile, reports a decline in unemployment shortly after demonetization, which may hide an important decline in labor force participation that the author also indicates is reported by Vyas (2018). Ongoing work with survey data from the Center for Monitoring Indian Economy, which produces a consumption aggregate that is comprehensive (although not fully comparable to the National Sample Survey) shows an increase in real average consumption between 2015 and 2017, but with a drop-off among the bottom quintile of the distribution. e. For instance, economists S. Subramanian (2019) and Himanshu (2019) argue that poverty rates went up significantly. However, Bhalla and Bhasin (2020) posit that poverty in 2017/18 declined significantly with respect to 2011/12.
Here are the excerpts from the report in their entirety: Measuring Poverty in India without Recent Data : World Bank Group Citing concerns over the quality of the data, the government of India decided not to release the 2017/18 All-India Household Consumer Expenditure Survey data from the 75th round, conducted by the National Statistical Office. This decision leaves an important gap in understanding poverty in the country, South Asia, and the world in recent years. The latest comprehensive household consumption expenditure survey data available for estimating poverty for India date to 2011/12, the 68th round of the National Sample Survey. The 2018 Poverty and Shared Prosperity report used the 2014/15 72nd round of the National Sample Survey, which includes some information on household characteristics and expenditures (but not the full consumption module used for poverty measurement) to impute a more comprehensive value of consumption (Newhouse and Vyas 2018; World Bank 2018). The results of this survey-to-survey imputation were used to derive the India estimate that underpins the 2015 global poverty count (see Chen et al. 2018, for details). Given the relevance of India for global poverty measurement and the lack of more recent data, this box summarizes several methodologies that have been used to approximate a poverty estimate for India to be used in the 2017 global poverty count. All these estimates are subject to strong assumptions; therefore, considerable uncertainty remains over poverty in India in 2017, and this uncertainty can be resolved only if new survey data become available. The first method is a pass- through exercise similar to the method adopted by the World Bank in its nowcasts and forecasts of global poverty (see below). A pass-through is a discount factor that accounts for the differences in growth rates in per capita household consumption expenditures in national accounts and the mean per capita household consumption expenditures recorded in surveys. Using all comparable consumption surveys available in PovcalNet, a pass-through rate of 0.67 (with a 95 percent confidence interval of [0.59, 0.75]) is estimated that is to be applied to per capita household final consumption expenditure (HFCE) growth in national accounts.a This estimate is in line with many of the pass-through rates available in the literature on this issue (Sen 2000; Datt, Kozel, and Ravallion 2003; Deaton and Kozel 2005; Lakner et al. 2020). Applying this pass-through estimate to per capita HFCE growth in India as reported in the World Development Indicators using official sources results in a national poverty rate estimate of 10.4 percent in 2017 for the US$1.90 poverty line, which translates into 139 million people living in extreme poverty. This number underpins the global poverty estimate (9.2 percent) for 2017 and the nowcast and forecast exercises shown in the rest of this chapter. The second approach uses survey-to-survey imputation techniques, similar to the approach used in the 2018 Poverty and Shared Prosperity report, to impute consumption into the 2017/18 Social Consumption Survey for Health (National Sample Survey, 75th round). This approach results in a lower national poverty estimate of 9.9 percent in 2017, with a 95 percent confidence interval of between 8.1 and 11.3. The India and South Asia estimates are reported for the widest range of estimates derived from these methods. For India, the values range between 8.1 percent and 11.3 percent nationally, that is, between 109 million and 152 million people.c This value would translate to between 7.7 percent and 10.0 percent poor in South Asia, that is, between 137 million and 180 million people. Neither approach is without limitations. The pass-through approach assumes that the national accounts estimates of HFCE growth are accurate and that growth is distribution-neutral. Both these assumptions have been the subject of recent debate in India. The survey-to-survey method takes advantage of the variation in the survey data to capture changes in the distribution of welfare. However, if the imputation is done between periods too far apart, it may fail to capture important changes in the behavior of markets. Important structural changes in the Indian economy between 2011 and 2017 may not be captured by these imputation techniques. Thus, the range of poverty estimates could be even wider than those presented in this report. The limitations of the methods described add to concerns about the lack of access to survey data to measure standards of living in India. Several economists and policy experts have used public news and media outlets to cite figures from different sources of data leading to opposite views about the direction of poverty rates in India in recent years.e The lack of data creates doubts among the general public, obstructs scientific debate, and hinders the implementation of sound, empirically based development policies. There is no alternative to timely, quality- assured, and transparent data for the design and monitoring of antipoverty policies. Appendix: a. Further details can be found in Edochie et al. (forthcoming). Because pass-through rates are found to vary systematically between consumption and income surveys (Lakner et al. 2020), only consumption surveys are included in this sample (which is the welfare aggregate used in India). For all regions except Sub-Saharan Africa, HFCE is the national accounts aggregate used by PovcalNet to line up surveys to the reference year (Prydz et al. 2019). To isolate real changes in consumption from one survey to the next, it is important to focus on comparable surveys using the comparability metadata described in Atamanov et al. (2019). b. See World Development Indicators (database), World Bank, Washington, DC, http://data.worldbank.org/products/wdi. c. The 95 percent confidence interval for the pass-through estimates gives a range of 10.0 percent to 10.8 percent for the national poverty rate, which is nested within this range. d. Academics have argued that India’s growth in gross domestic product from official sources may be overstated (A. Subramanian 2019), but these findings are disputed (Goyal and Kumar 2019). Regarding changes in inequality, Chanda and Cook (2019) and Chodorow-Reich et al. (2020) find a negative short-term impact of the demonetization introduced in November 2016 among the poorest groups, which dissipates after several months. Lahiri (2020), meanwhile, reports a decline in unemployment shortly after demonetization, which may hide an important decline in labor force participation that the author also indicates is reported by Vyas (2018). Ongoing work with survey data from the Center for Monitoring Indian Economy, which produces a consumption aggregate that is comprehensive (although not fully comparable to the National Sample Survey) shows an increase in real average consumption between 2015 and 2017, but with a drop-off among the bottom quintile of the distribution. e. For instance, economists S. Subramanian (2019) and Himanshu (2019) argue that poverty rates went up significantly. However, Bhalla and Bhasin (2020) posit that poverty in 2017/18 declined significantly with respect to 2011/12.
Latest Videos


